
 資料結構
資料結構 網路
網路 關係型資料庫管理系統
 作業系統
作業系統 Java
Java iOS
iOS HTML
HTML CSS
CSS Android
 Python
 C 語言程式設計
 C++
C++ C#
C# MongoDB
 MySQL
MySQL Javascript
 PHP
PHP如何使用 TensorFlow 在 Auto MPG 資料集上預測 MPG 值的 DNN(深度神經網路)模型?
Tensorflow 是 Google 提供的一個機器學習框架。它是一個開源框架,與 Python 結合使用以實現演算法、深度學習應用程式等等。它用於研究和生產目的。張量是 TensorFlow 中使用的資料結構。它有助於連線流圖中的邊。此流圖稱為“資料流圖”。張量只不過是多維陣列或列表。
可以使用以下程式碼行在 Windows 上安裝“tensorflow”包:
pip install tensorflow
迴歸問題的目標是預測連續或離散變數的輸出,例如價格、機率、是否會下雨等等。
我們使用的資料集稱為“Auto MPG”資料集。它包含 1970 年代和 1980 年代汽車的燃油效率。它包括重量、馬力、排量等屬性。透過此,我們需要預測特定車輛的燃油效率。
我們使用 Google Colaboratory 來執行以下程式碼。Google Colab 或 Colaboratory 幫助透過瀏覽器執行 Python 程式碼,並且無需任何配置即可免費訪問 GPU(圖形處理單元)。Colaboratory 建立在 Jupyter Notebook 之上。以下是程式碼片段:
。
示例
print("Model is being built and compiled")
dnn_model = build_compile_model(normalizer)
print("The statistical summary is displayed ")
dnn_model.summary()

print("The data is being fit to the model")
history = dnn_model.fit(
   train_features, train_labels,
   validation_split=0.2,
   verbose=0, epochs=100)
print("The error versus epoch is visualized")
plot_loss(history)
print("The predictions are being evaluated")
test_results['dnn_model'] = dnn_model.evaluate(test_features, test_labels, verbose=0)

pd.DataFrame(test_results, index=['Mean absolute error [MPG]']).T
程式碼來源 - https://www.tensorflow.org/tutorials/keras/regression
輸出

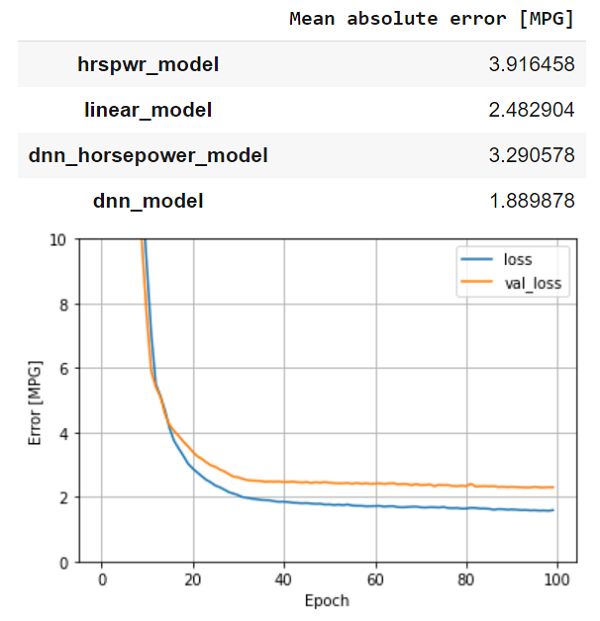
解釋
模型已構建並編譯。
使用“summary”函式顯示計數、均值、中位數等統計值。
此編譯後的模型適合資料。
在控制檯上繪製了步數與預測誤差的關係視覺化圖。
與線性迴歸相比,使用 DNN 更好。

更新於: 2021年1月20日
205 次檢視

廣告