
 資料結構
資料結構 網路
網路 關係資料庫管理系統
 作業系統
作業系統 Java
Java iOS
iOS HTML
HTML CSS
CSS Android
 Python
 C 程式設計
 C++
C++ C#
C# MongoDB
 MySQL
MySQL Javascript
 PHP
PHP如何使用 TensorFlow 和 Fashion MNIST 資料集,以便訓練好的模型能夠用於預測 Python 中的不同影像?
Tensorflow 是 Google 提供的一個機器學習框架。它是一個開源框架,與 Python 結合使用來實現演算法、深度學習應用程式等等。它用於研究和生產目的。它具有最佳化技術,有助於快速執行復雜的數學運算。這是因為它使用了 NumPy 和多維陣列。這些多維陣列也稱為“張量”。該框架支援使用深度神經網路。
可以使用以下程式碼行在 Windows 上安裝“tensorflow”包:
pip install tensorflow
張量是 TensorFlow 中使用的一種資料結構。它有助於連線流圖中的邊。此流圖稱為“資料流圖”。張量只不過是多維陣列或列表。可以使用三個主要屬性來識別它們:
秩 - 它告訴張量的維度。可以理解為張量的階數或已定義的張量中的維度數。
型別 - 它告訴張量元素關聯的資料型別。它可以是一維、二維或 n 維張量。
形狀 - 它是行數和列數的總和。
“Fashion MNIST”資料集包含各種服裝的影像。它包含超過 70,000 件屬於 10 個不同類別的服裝的灰度影像。這些影像是低解析度的(28 x 28 畫素)。
我們使用 Google Colaboratory 來執行以下程式碼。Google Colab 或 Colaboratory 幫助透過瀏覽器執行 Python 程式碼,無需任何配置,並且可以免費訪問 GPU(圖形處理單元)。Colaboratory 是建立在 Jupyter Notebook 之上的。
以下是程式碼片段:
示例
print("An image from the test data is taken")
img = test_images[26]
print("The dimensions of the image are ")
print(img.shape)
print("The image is added to batch where it is the only entity")
img = (np.expand_dims(img,0))
print("The dimensions of the image now ")
print(img.shape)
my_pred = probability_model.predict(img)
print("The prediction made is ")
print(my_pred)
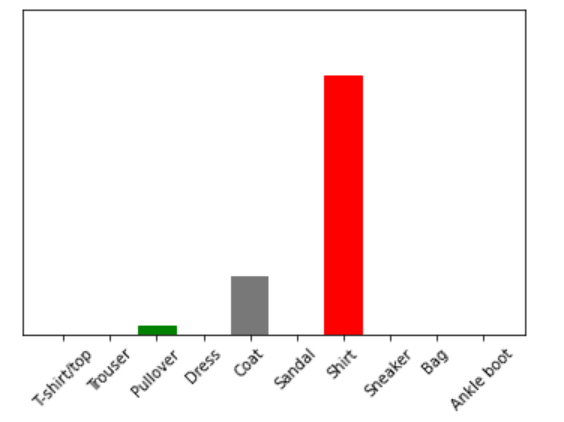
plot_value_array(1, my_pred[0], test_labels)
_ = plt.xticks(range(10), class_names, rotation=45)
np.argmax(my_pred[0])程式碼來源 - https://www.tensorflow.org/tutorials/keras/classification
輸出
An image from the test data is taken
The dimensions of the image are
(28, 28)
The image is added to batch where it is the only entity
The dimensions of the image now
(1, 28, 28)
The prediction made is
[[8.0459216e-07 1.7074371e-09 2.6175227e-02 1.8855806e-07 1.7909618e-01
2.1126857e-06 7.9472500e-01 7.5104166e-11 4.7921480e-07 1.6657851e-10]]
6
解釋
測試影像的維度顯示在控制檯上。
“expand_dims” 經過最佳化,可以同時處理批次或示例集合。
單個影像也作為列表的一部分新增。
predict 函式返回一個列表的列表,其中每個列表對應於批處理資料中的一個影像。
提取並顯示我們想要的影像的預測結果。
使用“matplotlib”將其視覺化為條形圖。

124 次瀏覽
