
 資料結構
資料結構 網路
網路 關係型資料庫管理系統
 作業系統
作業系統 Java
Java iOS
iOS HTML
HTML CSS
CSS Android
 Python
 C 程式設計
 C++
C++ C#
C# MongoDB
 MySQL
MySQL Javascript
 PHP
PHP如何在 CentOS 7 上使用 Docker 安裝和配置 Prometheus
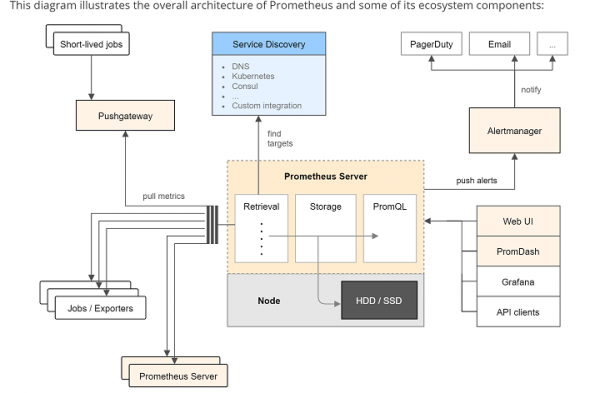
在這篇文章中,我們將學習如何安裝 Prometheus 伺服器來收集指標並查詢它們,以及安裝 Grafana - 一個基於 Web 的圖形儀表板構建器。Prometheus 是一個開源監控工具,帶有時序資料庫。它解決了監控的許多方面,並生成一系列指標和圖表,以便在儀表板上顯示資料以及發出警報。
先決條件
要完成本文,我們需要以下資源:已安裝 CentOS 7,具有 sudo 訪問許可權的使用者以及已安裝的 Docker。
安裝 Prometheus
我們使用 Docker 安裝 Prometheus,因此請確保我們已在 CentOS 7 機器上安裝 Docker。Prometheus 元件的 Docker 容器映象位於 Docker Hub 上的 prom 組織下。我們可以使用位於 /etc/Prometheus/Prometheus.yml 的演示配置啟動 Docker 映象,而無需使用任何選項。
我們有多種方法可以覆蓋預設配置檔案。可以將自定義配置檔案作為 Docker 資料卷從主機系統放入容器中,或者我們可以選擇使用我們自己的配置構建 Docker 容器,這裡為了演示目的,我們將選擇從主機系統傳入配置檔案。
建立最小 Prometheus 配置
$ nano ~/prometheus.yml
# A scrape configuration scraping a Node Exporter and the Prometheus server
# itself.
scrape_configs:
# Scrape Prometheus itself every 5 seconds.
- job_name: 'prometheus'
scrape_interval: 5s
target_groups:
- targets: ['localhost:9090']
# Scrape the Node Exporter every 5 seconds.
- job_name: 'node'
scrape_interval: 5s
target_groups:
- targets: ['192.168.1.100:9100']
使用以下命令啟動帶有此外部配置檔案的 Prometheus Docker 容器
$ docker run -d -p 9090:9090 -v ~/prometheus.yml:/etc/prometheus/prometheus.yml prom/prometheus -config.file=/etc/prometheus/prometheus.yml -storage.local.path=/prometheus -storage.local.memory-chunks=10000
此命令很長,在一行中包含許多命令和許多選項。
我們將看到上述命令中使用的每個選項。
The -d option starts the Prometheus container to start in detached mode, meaning that the container will be started in the background and will not be terminated by pressing CTRL+C.
The -p 9090:9090 option allows the Prometheus's web port (9090) and makes it reachable via the external IP address of the host system.
The -v [...] option mounts the prometheus.yml configuration file from the host filesystem from the location within the container where Prometheus expects it (/etc/prometheus/prometheus.yml)
The -config.file option is instruct the Dockers accordingly to the location of the Prometheus configuration file within the container.
The -storage.local.path option configures the metrics storage location within the container.
Finally, the -storage.local.memory-chunks option adjusts Prometheus's memory usage to the host system's very small amount of RAM (only 512MB) and small number of stored time series in this tutorial (just under 1000)
It instructs Prometheus to keep only 10000 sample chunks in memory (roughly 10 chunks per series), instead of the default of 1048576. This is a value you will definitely need to tune when running Prometheus on a machine with more RAM and when storing more time serie
Refer to Prometheus's storage documentation for detailed usage.
因為這是我們第一次執行此命令,所以它將從 Docker Hub 下載內容。
我們可以使用 docker ps 命令檢視本地機器上可用的 Docker 容器。
$ docker ps
CONTAINER ID IMAGE COMMAND CREATED STATUS PORTS NAMES
55e31548c9a0 prom/prometheus "/bin/prometheus -con" 26 seconds ago Up 24 seconds 0.0.0.0:9090->9090/tcp cocky_fermat
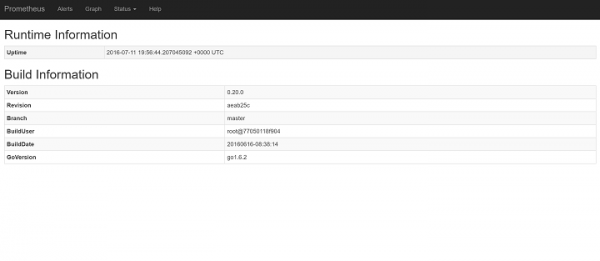
我們可以使用從 docker ps 命令獲取的容器 ID 來檢視 Prometheus 伺服器的日誌,以下是檢視日誌的命令:
$ docker logs 55e31548c9a0
time="2016-07-11T19:56:44Z" level=info msg="Starting prometheus (version=0.20.0, branch=master, revision=aeab25c)" source="main.go:73"
time="2016-07-11T19:56:44Z" level=info msg="Build context (go=go1.6.2, user=root@77050118f904, date=20160616-08:38:14)" source="main.go:74"
time="2016-07-11T19:56:44Z" level=info msg="Loading configuration file /etc/prometheus/prometheus.yml" source="main.go:206"
time="2016-07-11T19:56:44Z" level=warning msg="The 'target_groups' option for scrape configurations is deprecated, use 'static_configs' instead" source="config.go:468"
time="2016-07-11T19:56:44Z" level=warning msg="The 'target_groups' option for scrape configurations is deprecated, use 'static_configs' instead" source="config.go:468"
time="2016-07-11T19:56:44Z" level=info msg="Loading series map and head chunks..." source="storage.go:341"
time="2016-07-11T19:56:44Z" level=info msg="0 series loaded." source="storage.go:346"
time="2016-07-11T19:56:44Z" level=info msg="Starting target manager..." source="targetmanager.go:74"
time="2016-07-11T19:56:44Z" level=warning msg="No AlertManagers configured, not dispatching any alerts" source="notifier.go:174"
time="2016-07-11T19:56:44Z" level=info msg="Listening on :9090" source="web.go:241"
要查詢儲存的儲存卷,我們可以執行以下命令:
$ docker inspect 55e31548c9a0
[
   {
      "Id": "55e31548c9a0273bd91340bf08f5eb55996c8fe9a648b819b348d1a5af08990b",
      "Created": "2016-07-11T19:56:43.814310728Z",
      "Path": "/bin/prometheus",
      "Args": [
         "-config.file=/etc/prometheus/prometheus.yml",
         "-storage.local.path=/prometheus",
         "-storage.local.memory-chunks=10000"
      ],
      "State": {
         "Status": "running",
         "Running": true,
         "Paused": false,
         "Restarting": false,
         "OOMKilled": false,
         "Dead": false,
         "Pid": 4803,
         "ExitCode": 0,
         …
         …
         "Gateway": "172.17.0.1",
         "GlobalIPv6Address": "",
         "GlobalIPv6PrefixLen": 0,
         "IPAddress": "172.17.0.2",
         "IPPrefixLen": 16,
         "IPv6Gateway": "",
         "MacAddress": "02:42:ac:11:00:02",
         "Networks": {
            "bridge": {
               "IPAMConfig": null,
               "Links": null,
               "Aliases": null,
               "NetworkID": "4bbd72d2b2defe67b5223fe7f89919b9dd952e13f1d273ac871e8af1486b92c4",
               "EndpointID": "b35f6fe49c02b8a6593e4e8549f1ab46a6bdc3b94f0279315f49a30725832e74",
               "Gateway": "172.17.0.1",
               "IPAddress": "172.17.0.2",
               "IPPrefixLen": 16,
               "IPv6Gateway": "",
               "GlobalIPv6Address": "",
               "GlobalIPv6PrefixLen": 0,
               "MacAddress": "02:42:ac:11:00:02"
            }
         }
      }
   }
]
...
...
We can find that in the section
"Mounts": [
   {
      "Source": "/root/prometheus.yml",
      "Destination": "/etc/prometheus/prometheus.yml",
      "Mode": "",
      "RW": true,
      "Propagation": "rprivate"
   },
   {
      "Name": "1dd33b889f2fe804ceceb90d4100767a14a21b09ba880972f25a2bf452d31150",
      "Source":       "/var/lib/docker/volumes/1dd33b889f2fe804ceceb90d4100767a14a21b09ba880972f25a2bf452d31150/_data",
      "Destination": "/prometheus",
      "Driver": "local",
      "Mode": "",
      "RW": true,
      "Propagation": ""
   }
   ...
...
從輸出中,我們可以觀察到指標儲存在以下位置:“
/var/lib/docker/volumes/1dd33b889f2fe804ceceb90d4100767a14a21b09ba880972f25a2bf452d31150/_data”
登入 Prometheus 儀表板
該目錄已自動建立並對映到容器中的 /Prometheus 目錄。
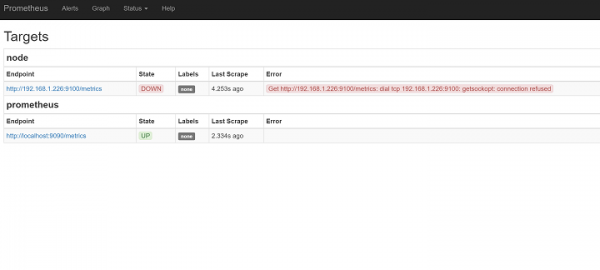
我們可以看到,容器已啟動並正在執行,我們現在可以在 http://your_ip:9090/ 或 http://192.168.1.226:9090/status 檢查 Prometheus 伺服器(注意:IP 地址可能與此演示到您的設定不同,因此請使用您的主機 IP 地址)。
我們必須單擊狀態並單擊目標。我們可以看到節點作為不健康狀態,並看到節點匯出器尚未啟動。
設定節點匯出器
這裡我們將安裝 Prometheus 節點匯出器。節點匯出器是公開主機機器的 Prometheus 指標的伺服器,它在其中執行,顯示機器的檔案系統、網路裝置、處理器、記憶體使用情況等。
由於我們的要求是使用 Docker 管理所有程序,因此我們將使用解決方法來提供 Docker 指標的近似值。
要使用 Docker 在埠 9100 上啟動節點匯出器,請使用以下命令。
$ docker run -d -p 9100:9100 -v "/proc:/host/proc" -v "/sys:/host/sys" -v "/:/rootfs" --net="host" prom/node-exporter -collector.procfs /host/proc -collector.sysfs /host/proc -collector.filesystem.ignored-mount-points "^/(sys|proc|dev|host|etc)($|/)"
Unable to find image 'prom/node-exporter:latest' locally
latest: Pulling from prom/node-exporter
385e281300cc: Already exists
a3ed95caeb02: Pull complete
e418e02f5f37: Already exists
061d745f0f4c: Pull complete
Digest: sha256:a2ae701df7f3ace9f60b890415db9310dd8c28b5446002c4e8ebd102242d076e
Status: Downloaded newer image for prom/node-exporter:latest
49c08ad640f10556fedc517532386d11fbf9a9b49fcf4c14c463ef5dab4a0737
節點匯出器使用的選項為
As most of the metircs are gathered from /proc and /sys from the Linux file system, and the /host dircotory using the Docker’s –v option
-collector.procfs and –collector.sysfs. They are used to instruct the Node Exporter to look for the /proc and /sys folders for a non-standard location
Dockers –v flag is used to mount the entire root (/) file system into the contain as (/rootfs)
-collector.filesystem.ignored-mount-points is used to ignore any other filesystem container which are belong to the host system.
--net=host is used to place the container in the same network as the host so that it can read the /proc/net/dev
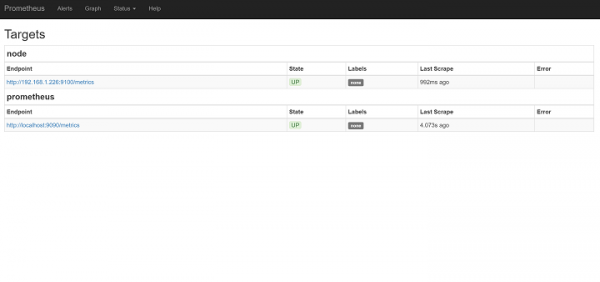
我們可以看到,Prometheus 伺服器將自動開始抓取節點匯出器。
http://192.168.1.226:9090/status
http://192.168.1.226:9100/metrics
設定 Grafana
由於 Prometheus 伺服器已安裝並準備就緒,我們現在將設定 Grafana。Grafana 是一個帶有儀表板的圖形介面,它支援 Prometheus 作為後端來查詢資料以生成圖表。
Grafana 將資料儲存在基於 SQL 的資料庫中,Grafana 支援 SQLite3、MySQL 或 PostgreSQL。在本教程中,我們使用 SQLite3 資料庫來儲存資料庫。
使用管理員密碼啟動 Grafana 作為 Docker 容器
$ docker run -d -p 3000:3000 -e "GF_SECURITY_ADMIN_PASSWORD=password" -v ~/grafana_db:/var/lib/grafana grafana/grafana
Unable to find image 'grafana/grafana:latest' locally
latest: Pulling from grafana/grafana
5c90d4a2d1a8: Pull complete
b1a9a0b6158e: Pull complete
acb23b0d58de: Pull complete
Digest: sha256:34ca2f9c7986cb2d115eea373083f7150a2b9b753210546d14477e2276074ae1
Status: Downloaded newer image for grafana/grafana:latest
5a2041049010fa0be8b23906cb2d864de7ff9a71e4930f686bc07eff24667d5a
上述命令將從 Docker Hub 下載 Grafana Docker 映象並存儲在本地系統的 ~/grafana_db 中,這將自動建立並在/var/lib/grafana/grafana.db 中初始化 SQLite3 資料庫。
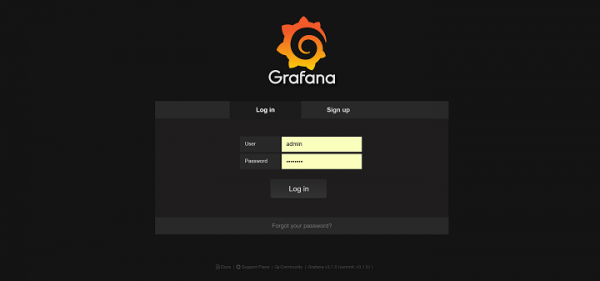
The –e option will pass the environment variables to process the Docker container and GF-SERCURITY_ADMIN_PASSWORD variable to the desired dashboard administrator password for admin user. The Grafana is currently running on port 3000
要登入 Grafana,請開啟連結 http://192.168.1.226:3000。IP 地址可能因系統而異。
由於沒有新增系統進行監控,我們將從 Grafana 圖示資料來源新增 http://192.168.1.226:9090 並新增 Prometheus 伺服器。

由於我們已使用 Docker 配置了 Prometheus 伺服器、節點匯出器和 Grafana,因為它們都在同一臺機器上執行,這僅用於演示目的。我們可以從各自的文件中瞭解更多關於 Prometheus 和 Grafana 的資訊。

942 次瀏覽
