
 資料結構
資料結構 網路
網路 關係型資料庫管理系統
 作業系統
作業系統 Java
Java iOS
iOS HTML
HTML CSS
CSS Android
 Python
 C 程式設計
 C++
C++ C#
C# MongoDB
 MySQL
MySQL Javascript
 PHP
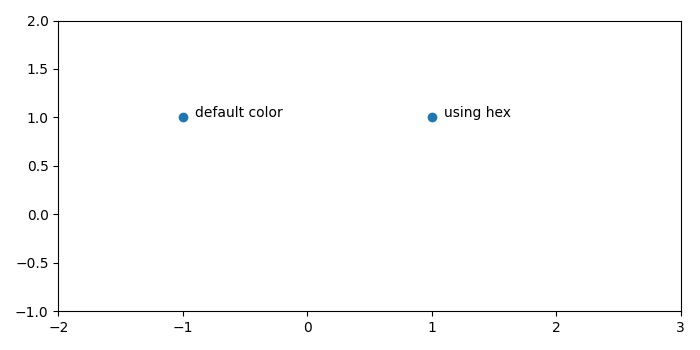
PHP如何獲取matplotlib.pyplot.scatter的預設藍色?
散點圖的預設顏色是藍色。要獲取 matplotlib 散點圖的預設藍色,我們可以使用 **annotate()** 方法對其進行註釋。
步驟
- 使用 **subplots()** 方法建立一個圖形和一組子圖。
- 在 (-1, 1) 位置繪製一個散點。
- 為該點新增一些標籤。
- 在 (-0.9, 1) 位置繪製一個散點。
- 為該點新增一些標籤。
- 在 (1.9, 1) 位置繪製一個散點。
- 為該點新增一些標籤。
- 使用 xlim 和 ylim 方法縮放 x 軸和 y 軸。
- 要顯示圖形,請使用 **show()** 方法。
示例
from matplotlib import pyplot as plt
plt.rcParams["figure.figsize"] = [7.00, 3.50]
plt.rcParams["figure.autolayout"] = True
fig, ax = plt.subplots()
ax.scatter(-1, 1)
ax.annotate("default color", xy=(-0.9, 1))
ax.scatter(1, 1, c='#1f77b4')
ax.annotate("using hex", xy=(1.1, 1))
ax.set_xlim(-2, 3)
ax.set_ylim(-1, 2)
plt.show()
輸出

更新於: 2021年5月15日
5K+ 瀏覽量

廣告