
 資料結構
資料結構 網路
網路 關係資料庫管理系統
 作業系統
作業系統 Java
Java iOS
iOS HTML
HTML CSS
CSS Android
 Python
 C 程式設計
 C++
C++ C#
C# MongoDB
 MySQL
MySQL Javascript
 PHP
PHP如何在 Python 中建立用於分類的模擬資料
在本教程中,我們將學習如何在 Python 中建立用於分類的模擬資料。
簡介
模擬資料可以定義為任何不代表真實現象但使用引數和約束條件合成生成的資料。
何時以及為何需要模擬資料?
有時,在對機器學習或深度學習中的特定演算法進行原型設計時,我們通常會面臨優質真實世界資料的短缺,這些資料可能對我們有用。有時,對於給定的任務,沒有此類資料可用。在這種情況下,我們可能需要合成生成的資料。這些資料也可以來自實驗室模擬。
模擬資料的優勢
主要體現資料可能存在的真實形式
包含較少的噪聲變化,因此可以被認為是理想的資料集
適用於快速原型設計和概念驗證
使用 Python 生成用於分類的模擬資料
在本演示中,我們將使用 sci-ki learn 生成模擬資料。
示例
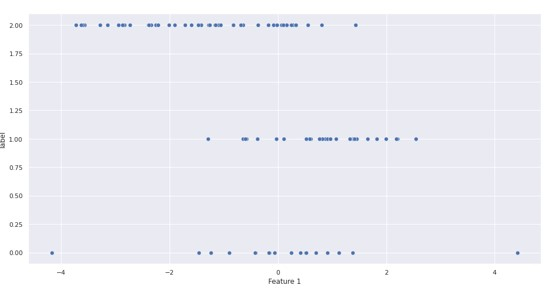
from sklearn.datasets import make_classification
import pandas as pd
import seaborn as sns

# Creating a simulated feature matrix and output vector with 100 samples
features, output = make_classification(n_samples = 100,

# taking ten features
n_features = 10,

# five features that predict the output's classes
n_informative = 5,

# five features that are random and unrelated to the output's classes
n_redundant = 5,

# three output classes
n_classes = 3,

# with 20% of observations in the first class, 30% in the second class,
# and 50% in the third class. ('None' makes balanced classes)
weights = [.2, .3, .8])
print("Feature Dataframe: ");
df_features = pd.DataFrame(features,
   columns=["Feature 1", "Feature 2","Feature 3", "Feature 4", "Feature 5","Feature 6", "Feature 7", "Feature 8", "Feature 9", "Feature 10"])
output_series = pd.Series(output,name='label')
df = pd.concat([df_features,output_series],axis=1)
print(df.head())
## plot using seaborn
sns.set(rc={"figure.figsize":(16, 8)})

## Plotting 'Feature 1' vs label
sns.scatterplot(data=df,x='Feature 1',y='label',s=50)
輸出
Feature Dataframe:
   Feature 1    Feature 2    Feature 3    Feature 4    Feature 5    Feature 6 \
0  0.849715     -0.381343    0.650106     -1.439747    -0.442026    0.785891
1  1.841786     0.912779     2.090686     -2.220130    -0.744132    -0.116817
2  -0.915034    -3.324696    -2.613417    0.852612     -3.908363    4.352266
3  1.305116     -1.582905    -0.797318    -0.943912    -1.753893    1.721998
4  0.894486     -0.130399    -0.968311    0.989773     -0.987330    -0.296457
   Feature 7    Feature 8    Feature 9    Feature 10 label
0  0.119725     1.156633     0.794226     0.511587   2
1  -0.064624    2.311732     0.178347     1.294978   1
2  3.038898     -2.273558    4.194868     2.693096   2
3  0.817046     0.577196     2.651006     1.826657   2
4 -0.280331     0.096983     1.227921     0.909471   2
另一種方法是使用 Faker Python 庫。讓我們透過以下示例瞭解一下。安裝 Faker 庫
示例
!pip install Faker

from random import randint
import pandas as pd
from faker import Faker
from faker.providers import DynamicProvider

medical_professions_provider = DynamicProvider(
   provider_name="medical_profession",
   elements=["dr.", "doctor", "nurse", "surgeon", "clerk"],
)
fake = Faker()
fake.add_provider(medical_professions_provider)

def input_data(x):
   # pandas dataframe
   data = pd.DataFrame()
   for i in range(0, x):
      data.loc[i,'id']= randint(1, 100)
      data.loc[i,'name']= fake.name()
      data.loc[i,'address']= fake.address()
      data.loc[i,'latitude']= str(fake.latitude())
      data.loc[i,'longitude']= str(fake.longitude())
      data.loc[i,'target'] = str(fake.medical_profession())
   return data
print(input_data(10))
輸出
id	name	address	\
	7.0	Monique Rodriguez	481 Rebecca Landing Suite 727\nDominiquefurt, ...
	4.0	Elizabeth Johnson	62492 Zimmerman Crest Apt. 047\nPort Jerome, W...
	18.0	Max Rangel	4379 Obrien Curve\nDavistown, IA 02341
	31.0	Tammie Kent	4866 Angela Turnpike Apt. 658\nNorth Sheilabor...
	42.0	James Johnston	26827 Jeremiah Alley\nFreystad, SC 86902
	21.0	Shawn Robles	137 Jessica Ridges Apt. 436\nWilliamburgh, AZ ...
	13.0	Stephen Hodges	Unit 9799 Box 0625\nDPO AA 94415
	91.0	Eric Lewis PhD	4711 Nicholas Loaf\nWest Lisa, UT 28944
	68.0	Matthew Munoz	37836 White Crest\nGonzalezport, NC 75320
	34.0	Lawrence Anderson	76712 Garza Mills Apt. 751\nPort Penny, CT 43042

latitude		longitude	target 0	60.574796	109.367770		clerk
1	84.7225155	-167.216393	dr.
2	82.598649	62.961322	surgeon
3	26.9617205	89.333171	doctor
4	-37.1740195	-140.766121	dr.
5	-40.8904645	28.820918	clerk
6	88.809220	76.442779	dr.
7	35.728143	178.729120	doctor
8	-16.5669945	126.686740	dr.
9	-49.271970	160.737754	clerk
結論
模擬資料在日常機器學習應用程式中非常有用,可用於原型設計或小型概念驗證。Python 中有一些方便的工具,可以使在幾行程式碼內建立模擬資料變得非常簡單。

更新於: 2022-12-01
296 次瀏覽

廣告