
 資料結構
資料結構 網路
網路 關係資料庫管理系統 (RDBMS)
 作業系統
作業系統 Java
Java iOS
iOS HTML
HTML CSS
CSS Android
 Python
 C語言程式設計
 C++
C++ C#
C# MongoDB
 MySQL
MySQL Javascript
 PHP
PHP如何使用Python的Bokeh更改刻度標籤大小
Bokeh是Python中可用的資料視覺化庫之一,它允許使用者在Web瀏覽器中建立互動式圖表、資料應用程式和儀表板。Bokeh提供各種圖表,例如散點圖、線圖、條形圖和麵積圖等,以及更專業的熱力圖和地理地圖。這是一個擁有活躍開發者社群的開源庫。
使用Python中的Bokeh建立圖表
Bokeh庫提供兩種主要的介面來建立圖表,一種是低階介面,用於從單個元件開發圖表;另一種是高階介面,用於從簡單的Python程式碼開發圖表。高階介面比低階介面更高階,提供更直觀、更簡單的方法來建立不同型別的圖表。
Bokeh庫支援廣泛的選項,允許使用者透過添加註釋和互動來控制圖表,並允許我們包含來自各種來源的資料。
Bokeh庫的特性
以下是Bokeh庫的關鍵特性。
它在Web瀏覽器中提供互動式資料視覺化。
該庫的輸出可以是HTML、PNG和SVG。
它支援即時和流資料。
它還支援地理地圖和資料探索。
它可以與NumPy和Pandas等庫整合。
在資料視覺化和繪圖中,刻度是圖表中用於標識顯示資料的少量標記或指示器。繪圖中提供了兩種型別的刻度。一種是x軸刻度,另一種是y軸刻度。
安裝Bokeh庫
要在Python中使用Bokeh庫,首先必須使用以下程式碼安裝該庫。
pip install bokeh
在Python中成功安裝Bokeh庫後,將生成以下輸出
pip install bokeh
Collecting bokeh
  Downloading bokeh-3.1.1-py3-none-any.whl (8.3 MB)
     ---------------------------------------- 8.3/8.3 MB 44.2 MB/s eta 0:00:00
. . . . . . . . . . . . . . . . . . . . . . . . . . . . . . . . . . . .
. . . . . . . . . . . . . . . . . . . . . . . . . . . . . . . . . . . .
. . . . . . . . . . . . . . . . . . . . . . . . . . . . . . . . . . . .
  Downloading six-1.16.0-py2.py3-none-any.whl (11 kB)
Installing collected packages: pytz, xyzservices, tzdata, tornado, six, PyYAML, pillow, packaging, numpy, MarkupSafe, python-dateutil, Jinja2, contourpy, pandas, bokeh
  Consider adding this directory to PATH or, if you prefer to suppress this warning, use --no-warn-script-location.
  Consider adding this directory to PATH or, if you prefer to suppress this warning, use --no-warn-script-location.
Successfully installed Jinja2-3.1.2 MarkupSafe-2.1.2 PyYAML-6.0 bokeh-3.1.1 contourpy-1.0.7 numpy-1.24.3 packaging-23.1 pandas-2.0.1 pillow-9.5.0 python-dateutil-2.8.2 pytz-2023.3 six-1.16.0 tornado-6.3.2 tzdata-2023.3 xyzservices-2023.2.0
示例
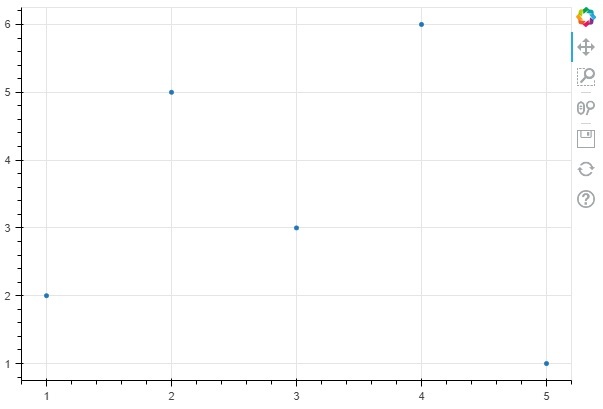
在這個示例中,我們將使用Bokeh庫建立圖表,而無需在圖表中指定刻度。以下是可用作參考的程式碼。
在下面的程式碼中,我們從Bokeh庫匯入figure和show函式,然後指定圖表的尺寸,併為x和y變數的資料繪製散點圖,最後顯示建立的圖表。
from bokeh.plotting import figure, show
p = figure(width=600, height=400)
x = [1, 2, 3, 4, 5]
y = [2, 5, 3, 6, 1]
p.scatter(x, y)
show(p)
輸出
以下是使用Bokeh庫建立的散點圖的輸出。
示例
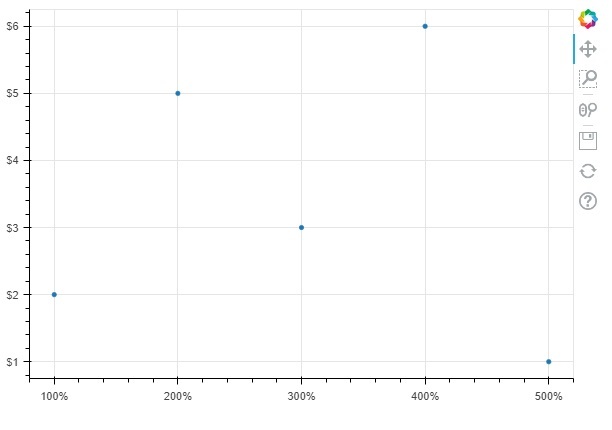
在下面的示例中,我們將使用Bokeh庫的NumeralTickFormatter()函式指定刻度。
from bokeh.plotting import figure, show
from bokeh.models import NumeralTickFormatter
p = figure(width=600, height=400)
x = [1, 2, 3, 4, 5]
y = [2, 5, 3, 6, 1]
p.scatter(x, y)
p.yaxis.formatter = NumeralTickFormatter(format="$0,0")
p.xaxis.formatter = NumeralTickFormatter(format = "%0,0")
show(p)
輸出
以下是使用帶有x軸和y軸刻度的Bokeh函式建立的散點圖的輸出。
示例
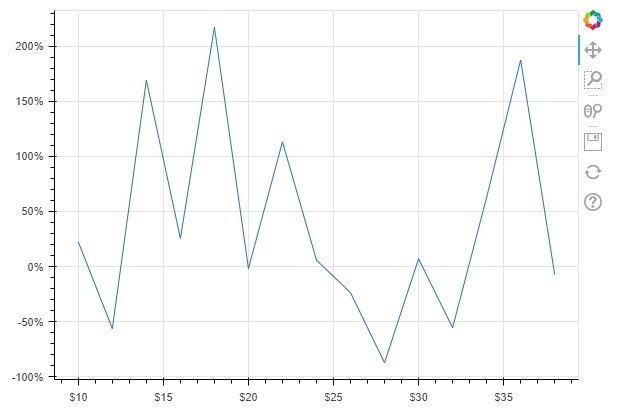
讓我們再看一個示例,透過使用NumeralTickFormatter()函式在x軸和y軸上應用刻度。
from bokeh.plotting import figure, show
from bokeh.models import NumeralTickFormatter
import numpy as np
p = figure(width=600, height=400)
x = np.arange(10,40,2)
y = np.random.randn(20)
p.line(x, y)
p.yaxis.formatter = NumeralTickFormatter(format="%0,0")
p.xaxis.formatter = NumeralTickFormatter(format = "$0,0")
show(p)
輸出
以下是使用scatter()和NumeralTickFormatter()函式繪製的圖表中使用的刻度的輸出。

138 次瀏覽
