
 資料結構
資料結構 網路
網路 RDBMS
RDBMS 作業系統
作業系統 Java
Java iOS
iOS HTML
HTML CSS
CSS Android
 Python
 C 程式設計
 C++
C++ C#
C# MongoDB
 MySQL
MySQL Javascript
 PHP
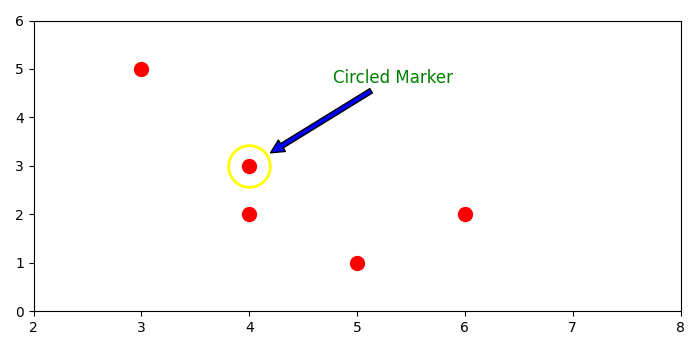
PHP如何在 matplotlib 中放置帶標註的圓?
若要在 matplotlib 中放置帶標註的圓,我們可以採取以下步驟:-
- 設定圖形大小並調整子圖之間和周圍的內邊距。
- 使用 numpy 建立資料點。
- 獲取放置帶註釋的圓的點座標。
- 獲取當前軸。
- 使用 plot() 方法繪製資料和資料點。
- 設定 X 和 Y 軸刻度。
- 若要放置一個圓形標記,請將 plot() 方法與 marker='o' 和某些屬性一起使用。
- 使用箭頭樣式註釋該圓(步驟 7)。
- 若要顯示圖形,請使用 show() 方法。
示例
import matplotlib.pyplot as plt
import numpy as np

plt.rcParams["figure.figsize"] = [7.00, 3.50]
plt.rcParams["figure.autolayout"] = True

data = np.array([[5, 3, 4, 4, 6],
   [1, 5, 3, 2, 2]])
point = data[:, 2]
ax = plt.gca()
ax.plot(data[0], data[1], 'o', ms=10, color='red')

ax.set_xlim([2, 8])
ax.set_ylim([0, 6])
radius = 15

ax.plot(point[0], point[1], 'o',
   ms=radius * 2, mec='yellow', mfc='none', mew=2)

ax.annotate('Circled Marker', xy=point, xytext=(60, 60),
   textcoords='offset points',
   color='green', size='large',
   arrowprops=dict(
      arrowstyle='simple,tail_width=0.3,head_width=0.8,head_length=0.8',
      facecolor='b', shrinkB=radius * 1.2)
   )

plt.show()
輸出
它會產生以下輸出


更新日期:19-Sep-2021
3K+ 瀏覽

廣告