
 資料結構
資料結構 網路
網路 RDBMS
RDBMS 作業系統
作業系統 Java
Java iOS
iOS HTML
HTML CSS
CSS Android
 Python
 C 程式設計
 C++
C++ C#
C# MongoDB
 MySQL
MySQL Javascript
 PHP
PHP如何在 Matplotlib 條形圖中獲取所有條形圖?
要獲取 Matplotlib 圖表中的所有條形圖,我們可以使用 bar() 方法並返回條形圖。−
步驟
- 設定圖形大小並調整子圖之間和周圍的填充。
- 建立圖形和一組子圖。
- 使用 subplots() 方法建立 x 和 y 資料點。
- 進行條形圖繪製,並將其儲存在 bars 變數中。
- 設定特定條形圖集的面部顏色。
- 要顯示圖形,請使用 show() 方法。
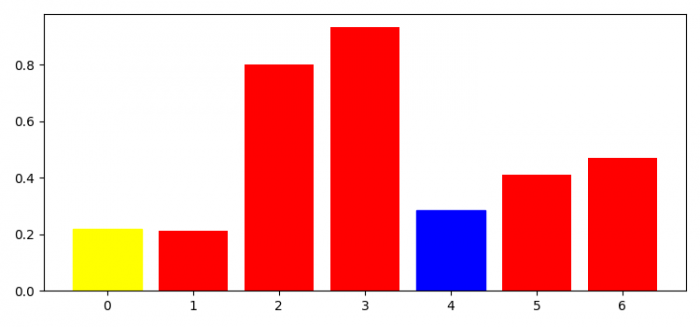
示例
import numpy as np
import matplotlib.pyplot as plt

plt.rcParams["figure.figsize"] = [7.50, 3.50]
plt.rcParams["figure.autolayout"] = True

fig, ax = plt.subplots()

x = np.arange(7)
y = np.random.rand(7)

bars = ax.bar(x, y, color='red')
bars[0].set_color('yellow')
bars[4].set_color('blue')

plt.show()
輸出

更新於: 2021 年 7 月 7 日
376 次檢視

廣告